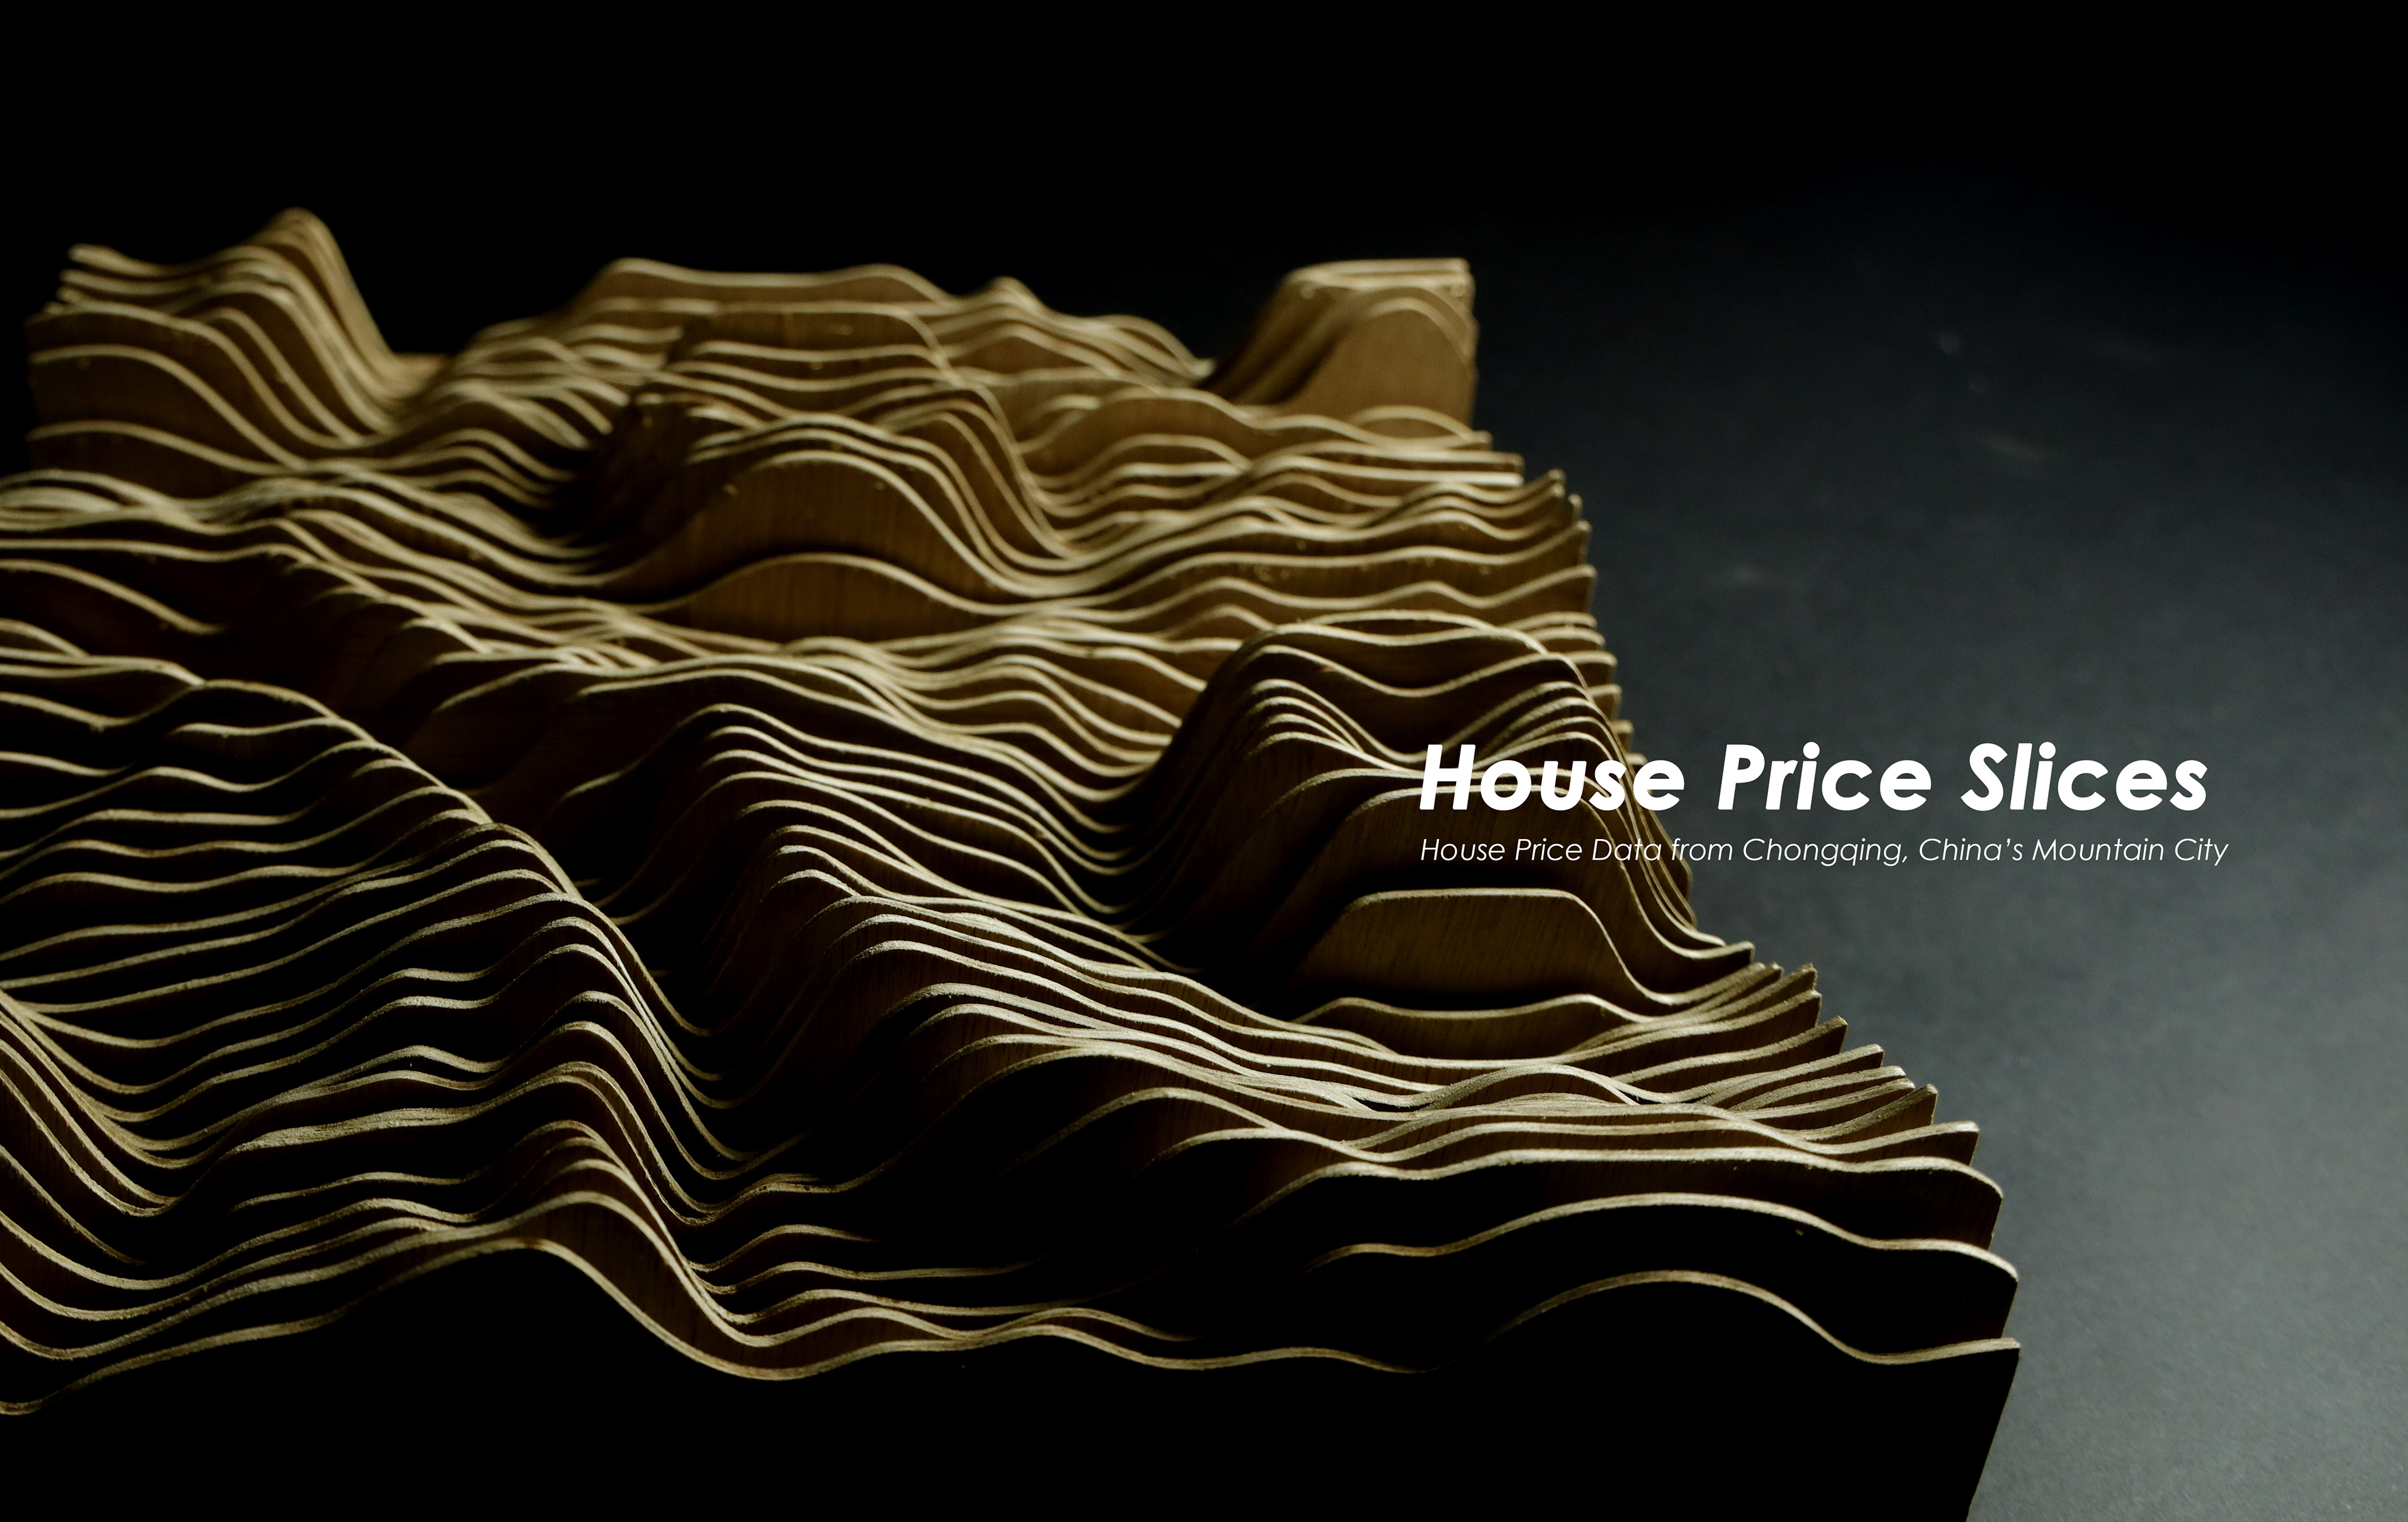
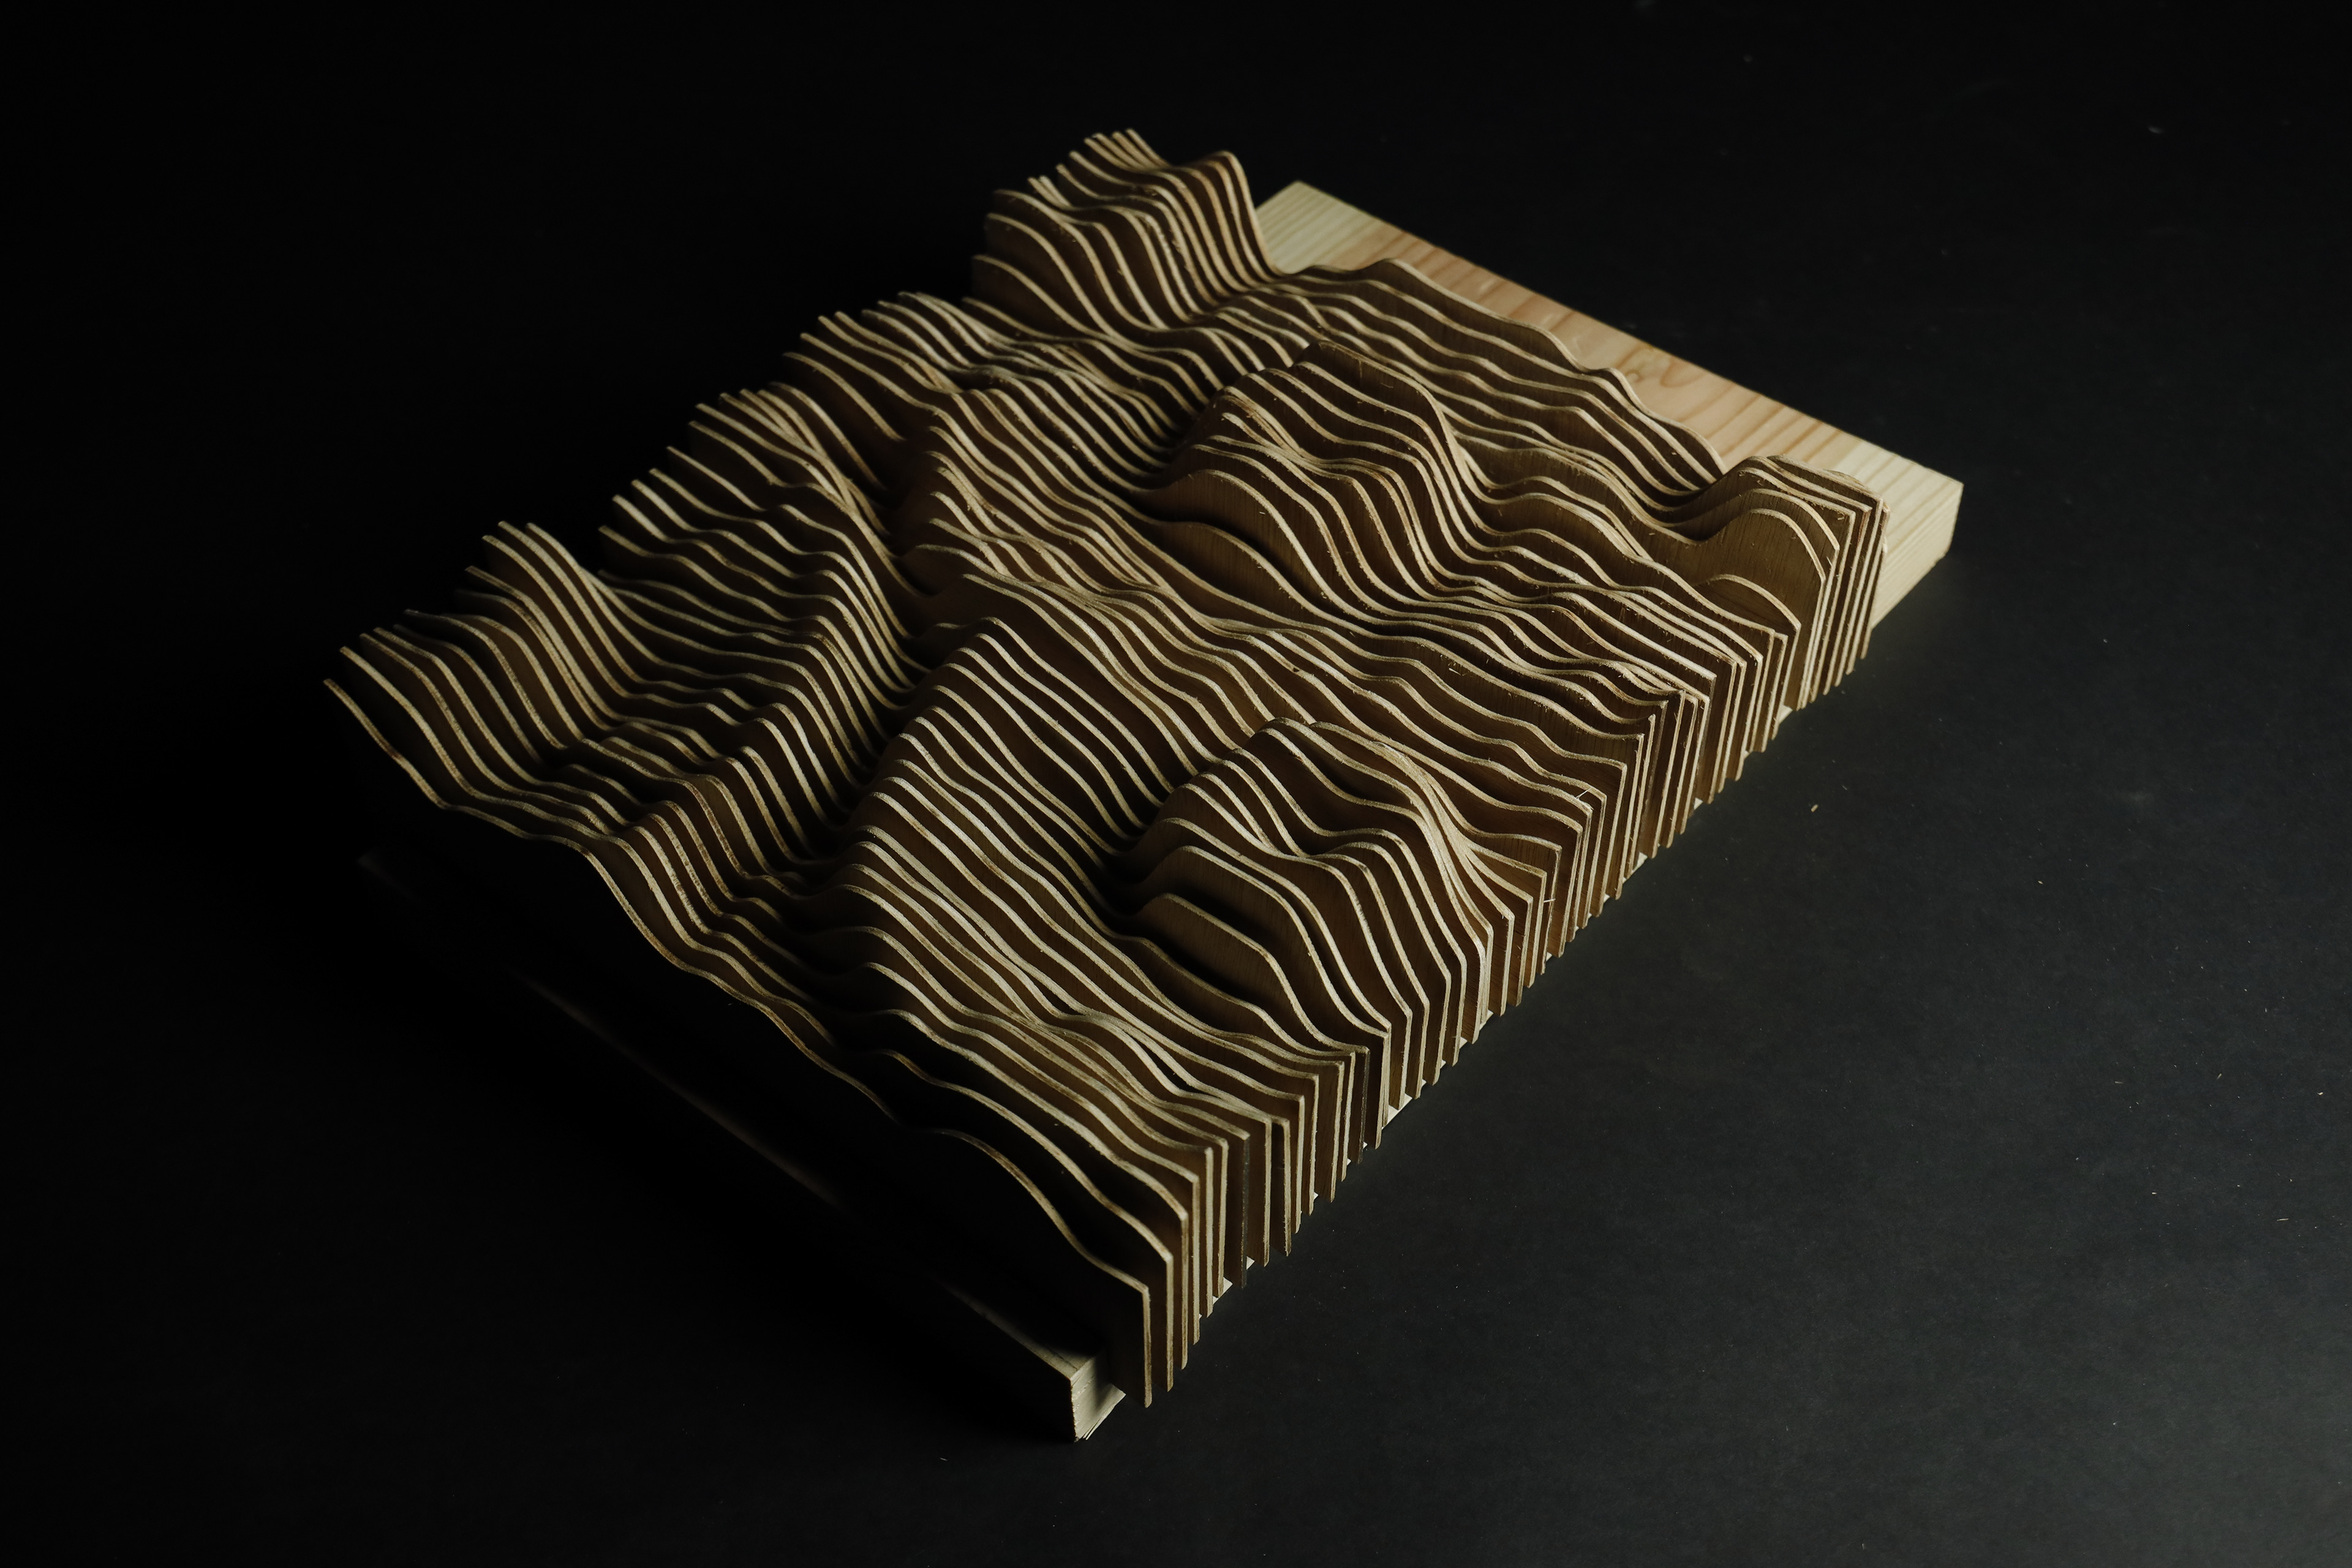
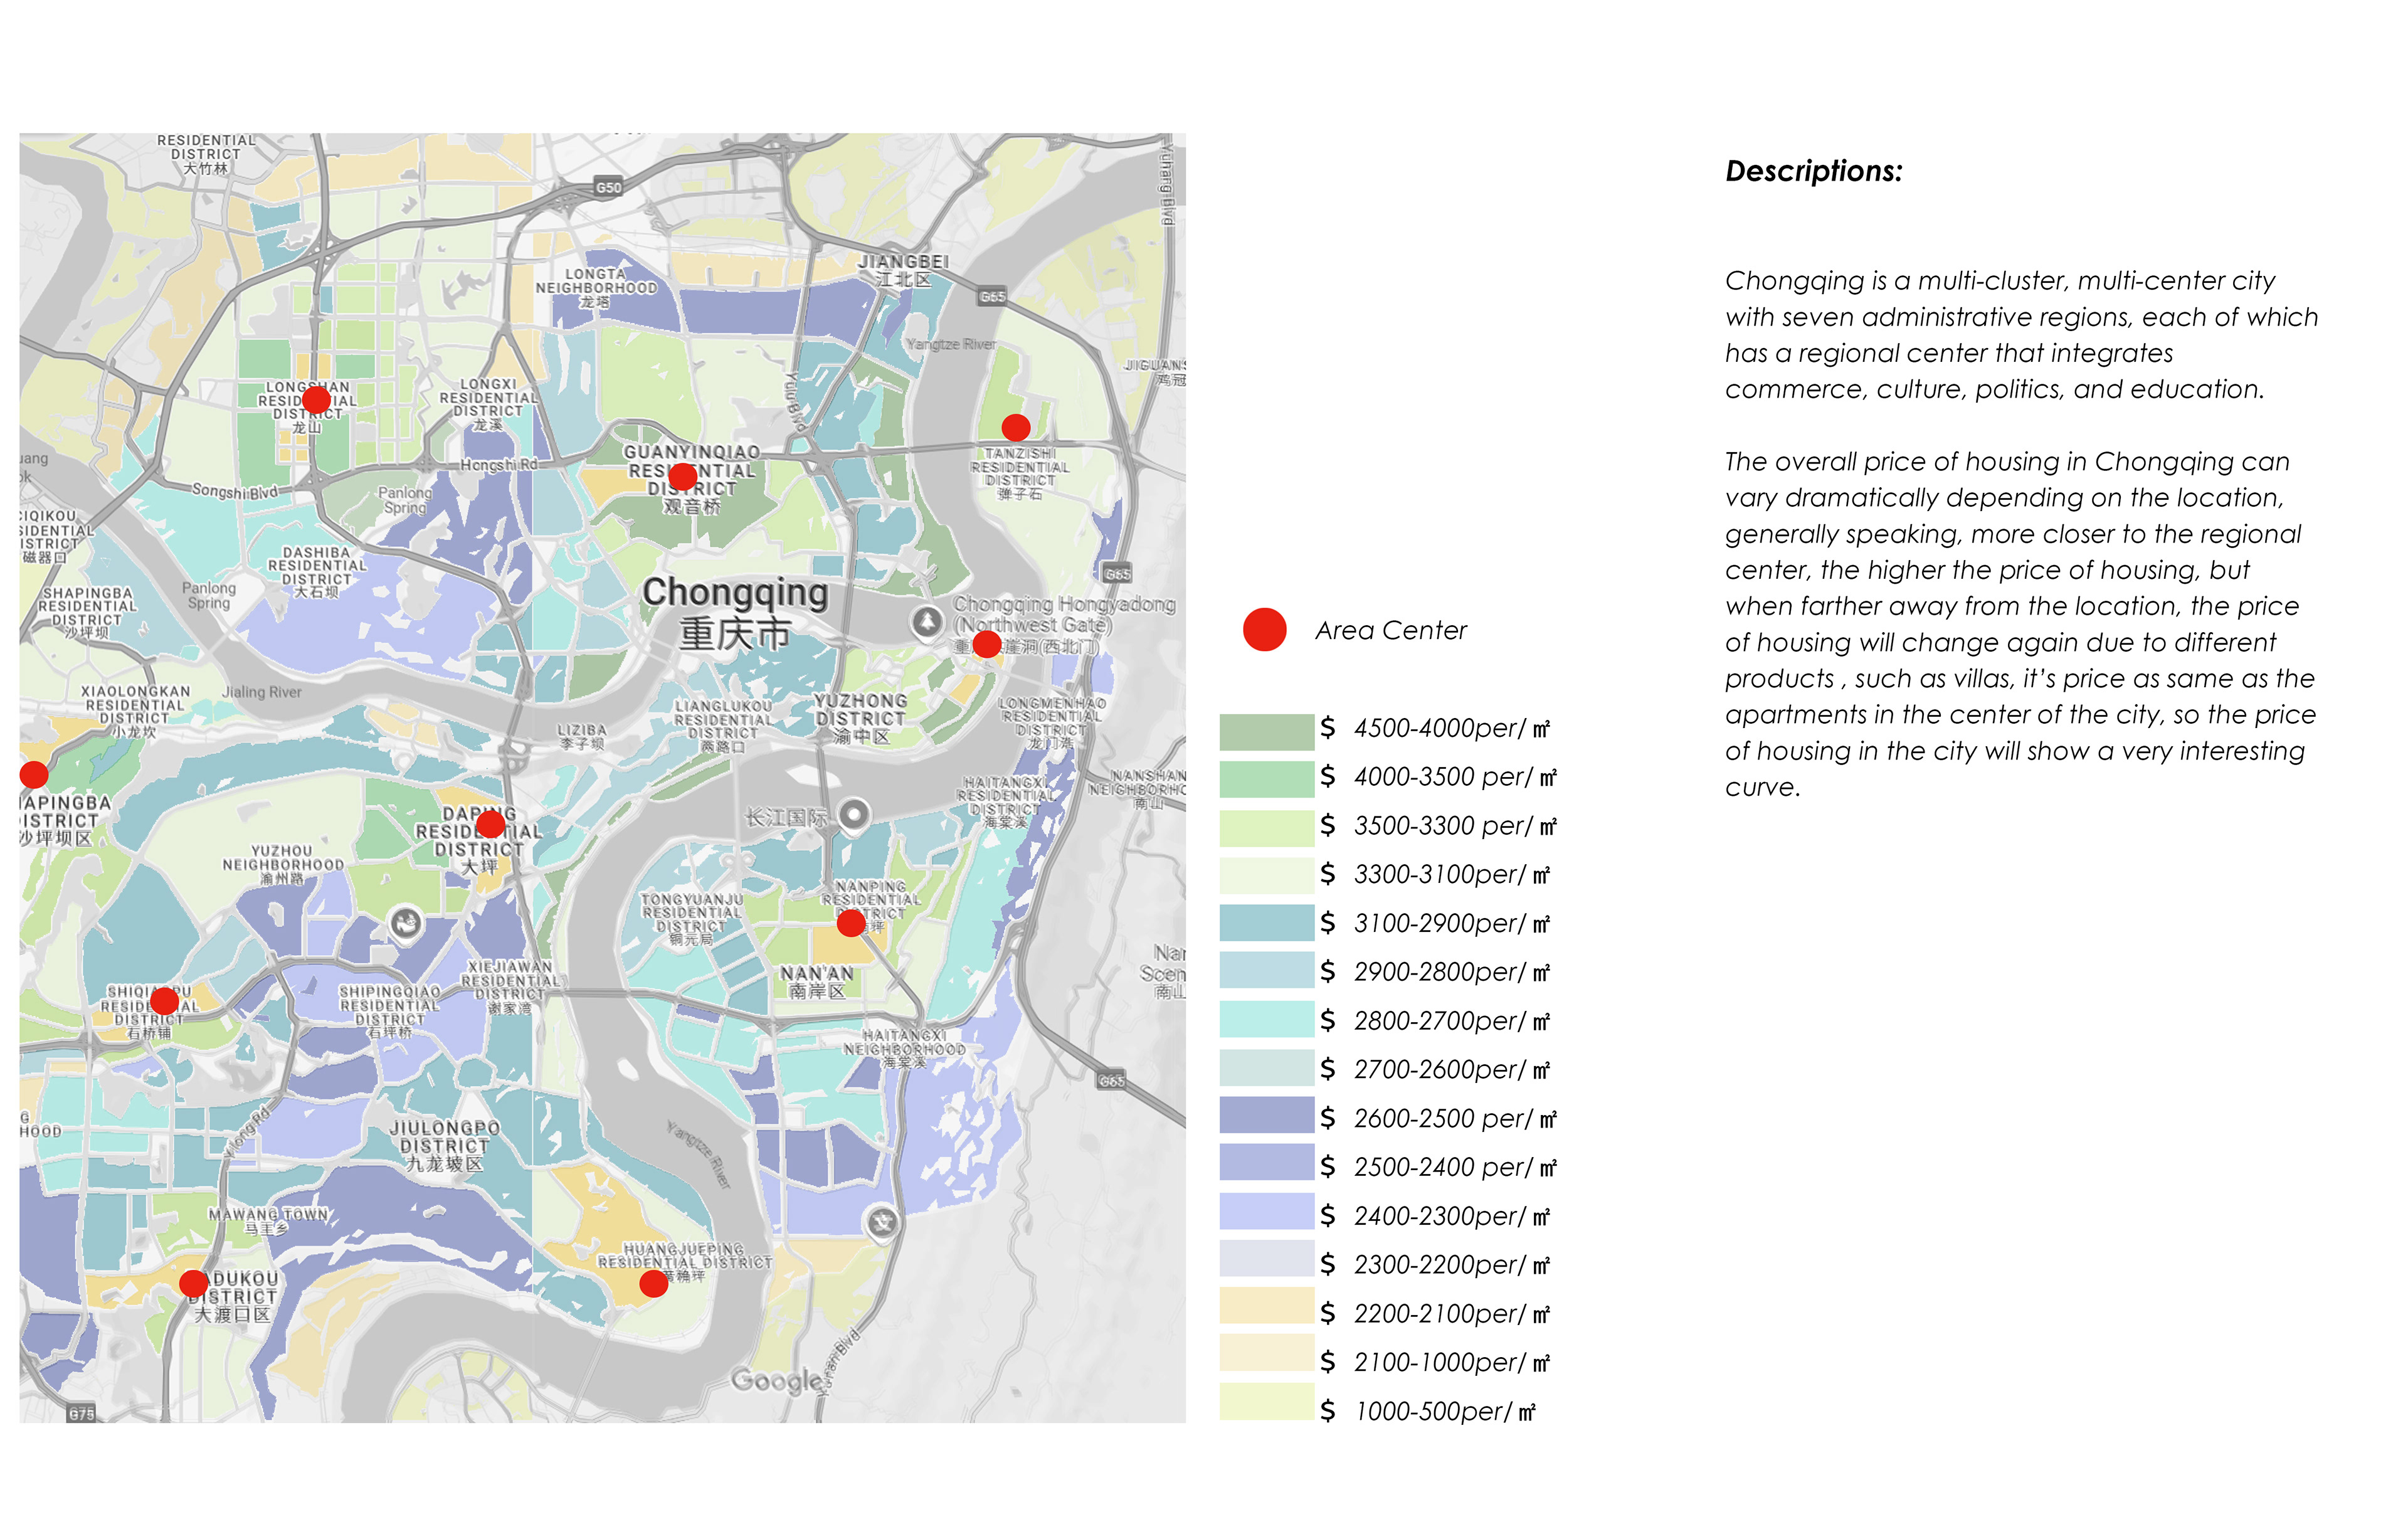
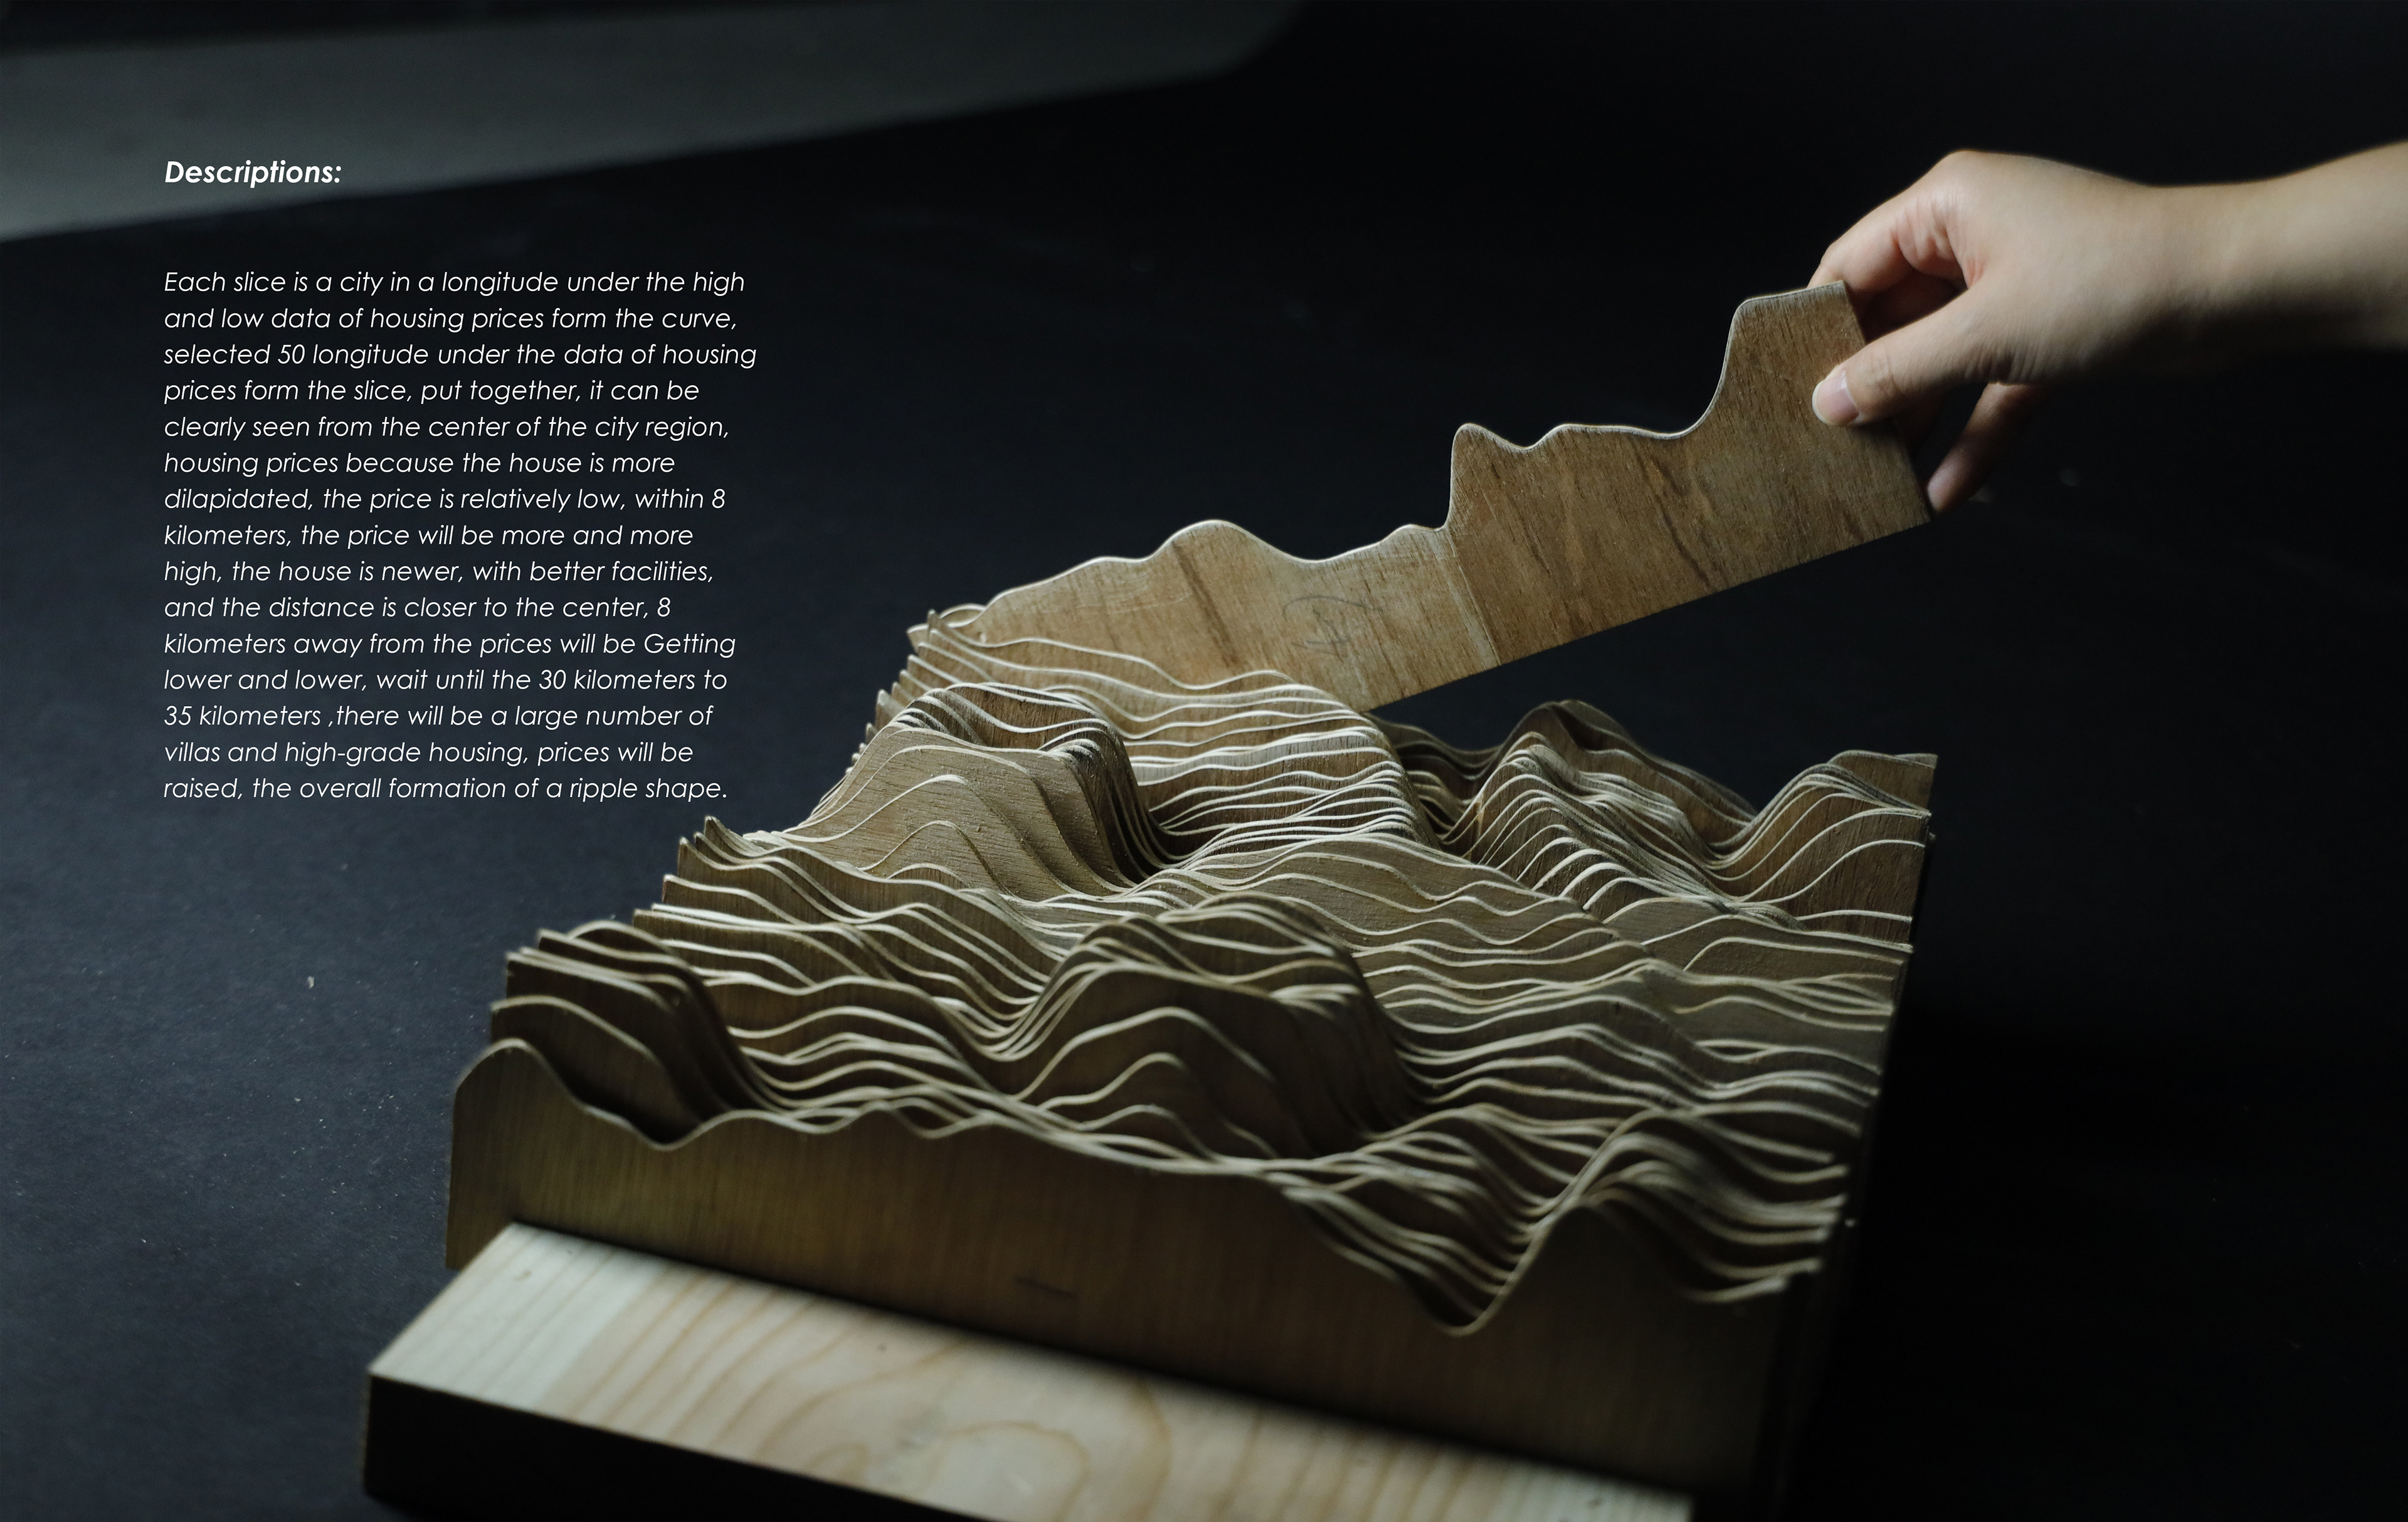
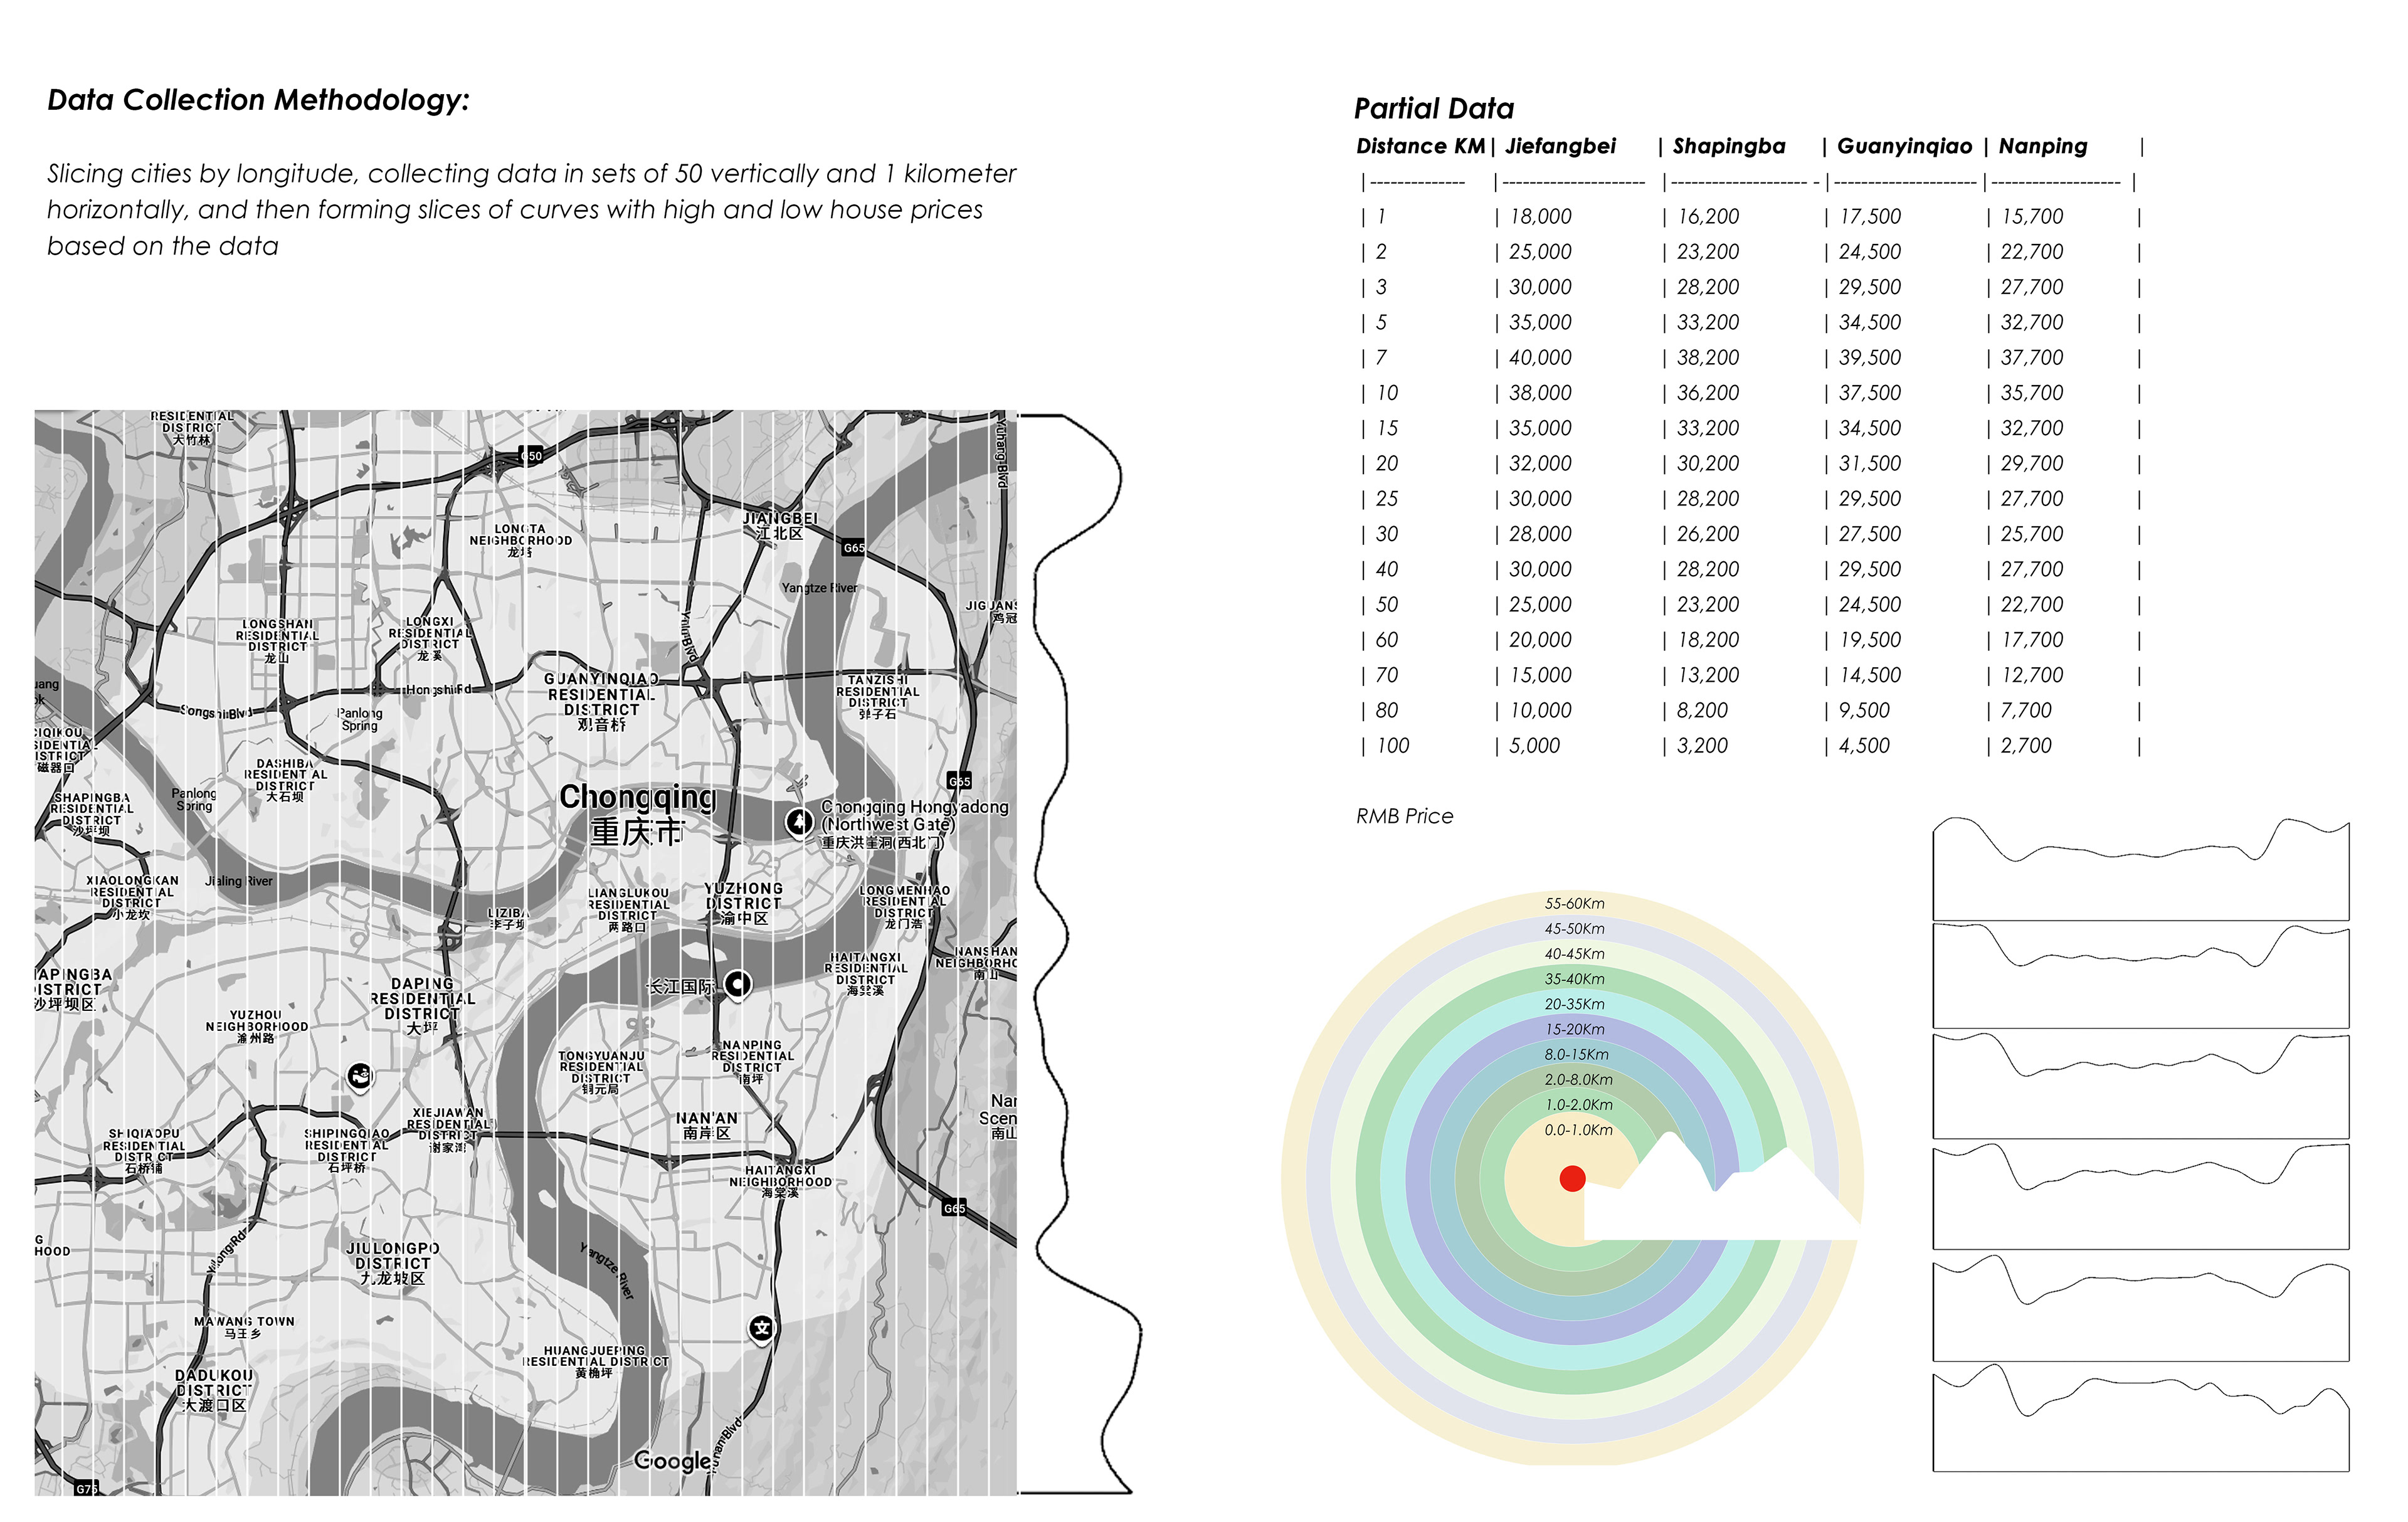
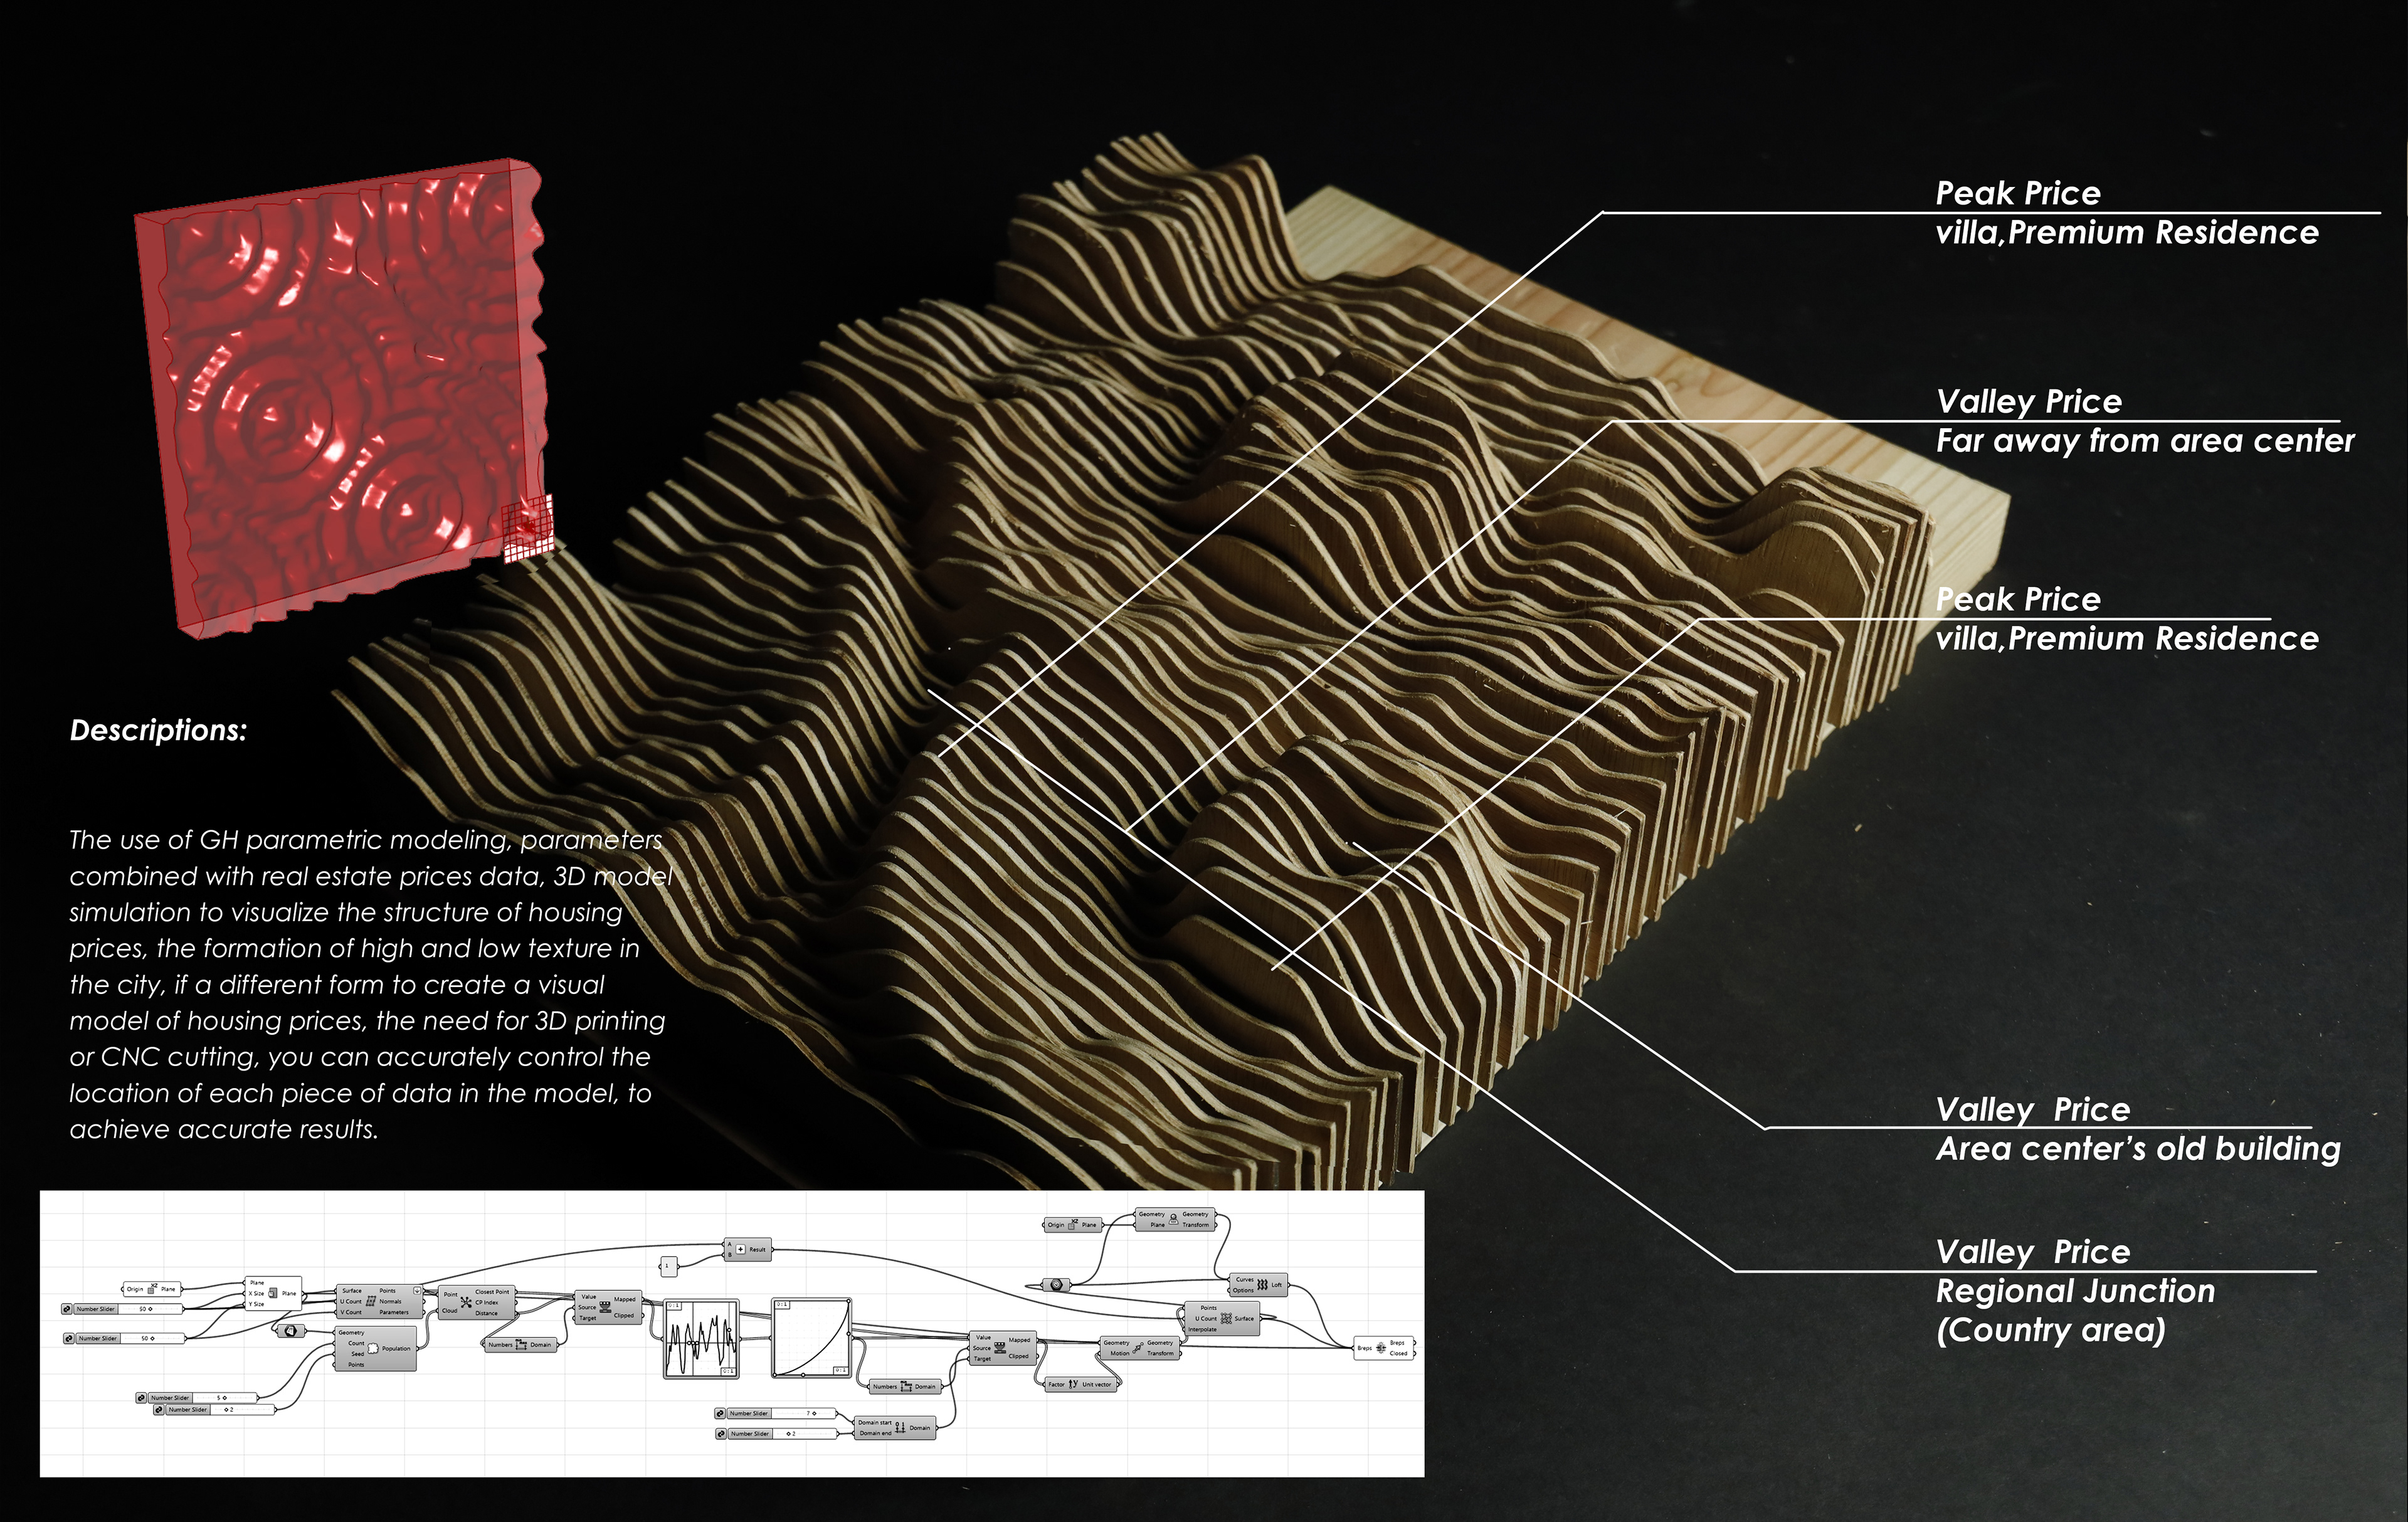
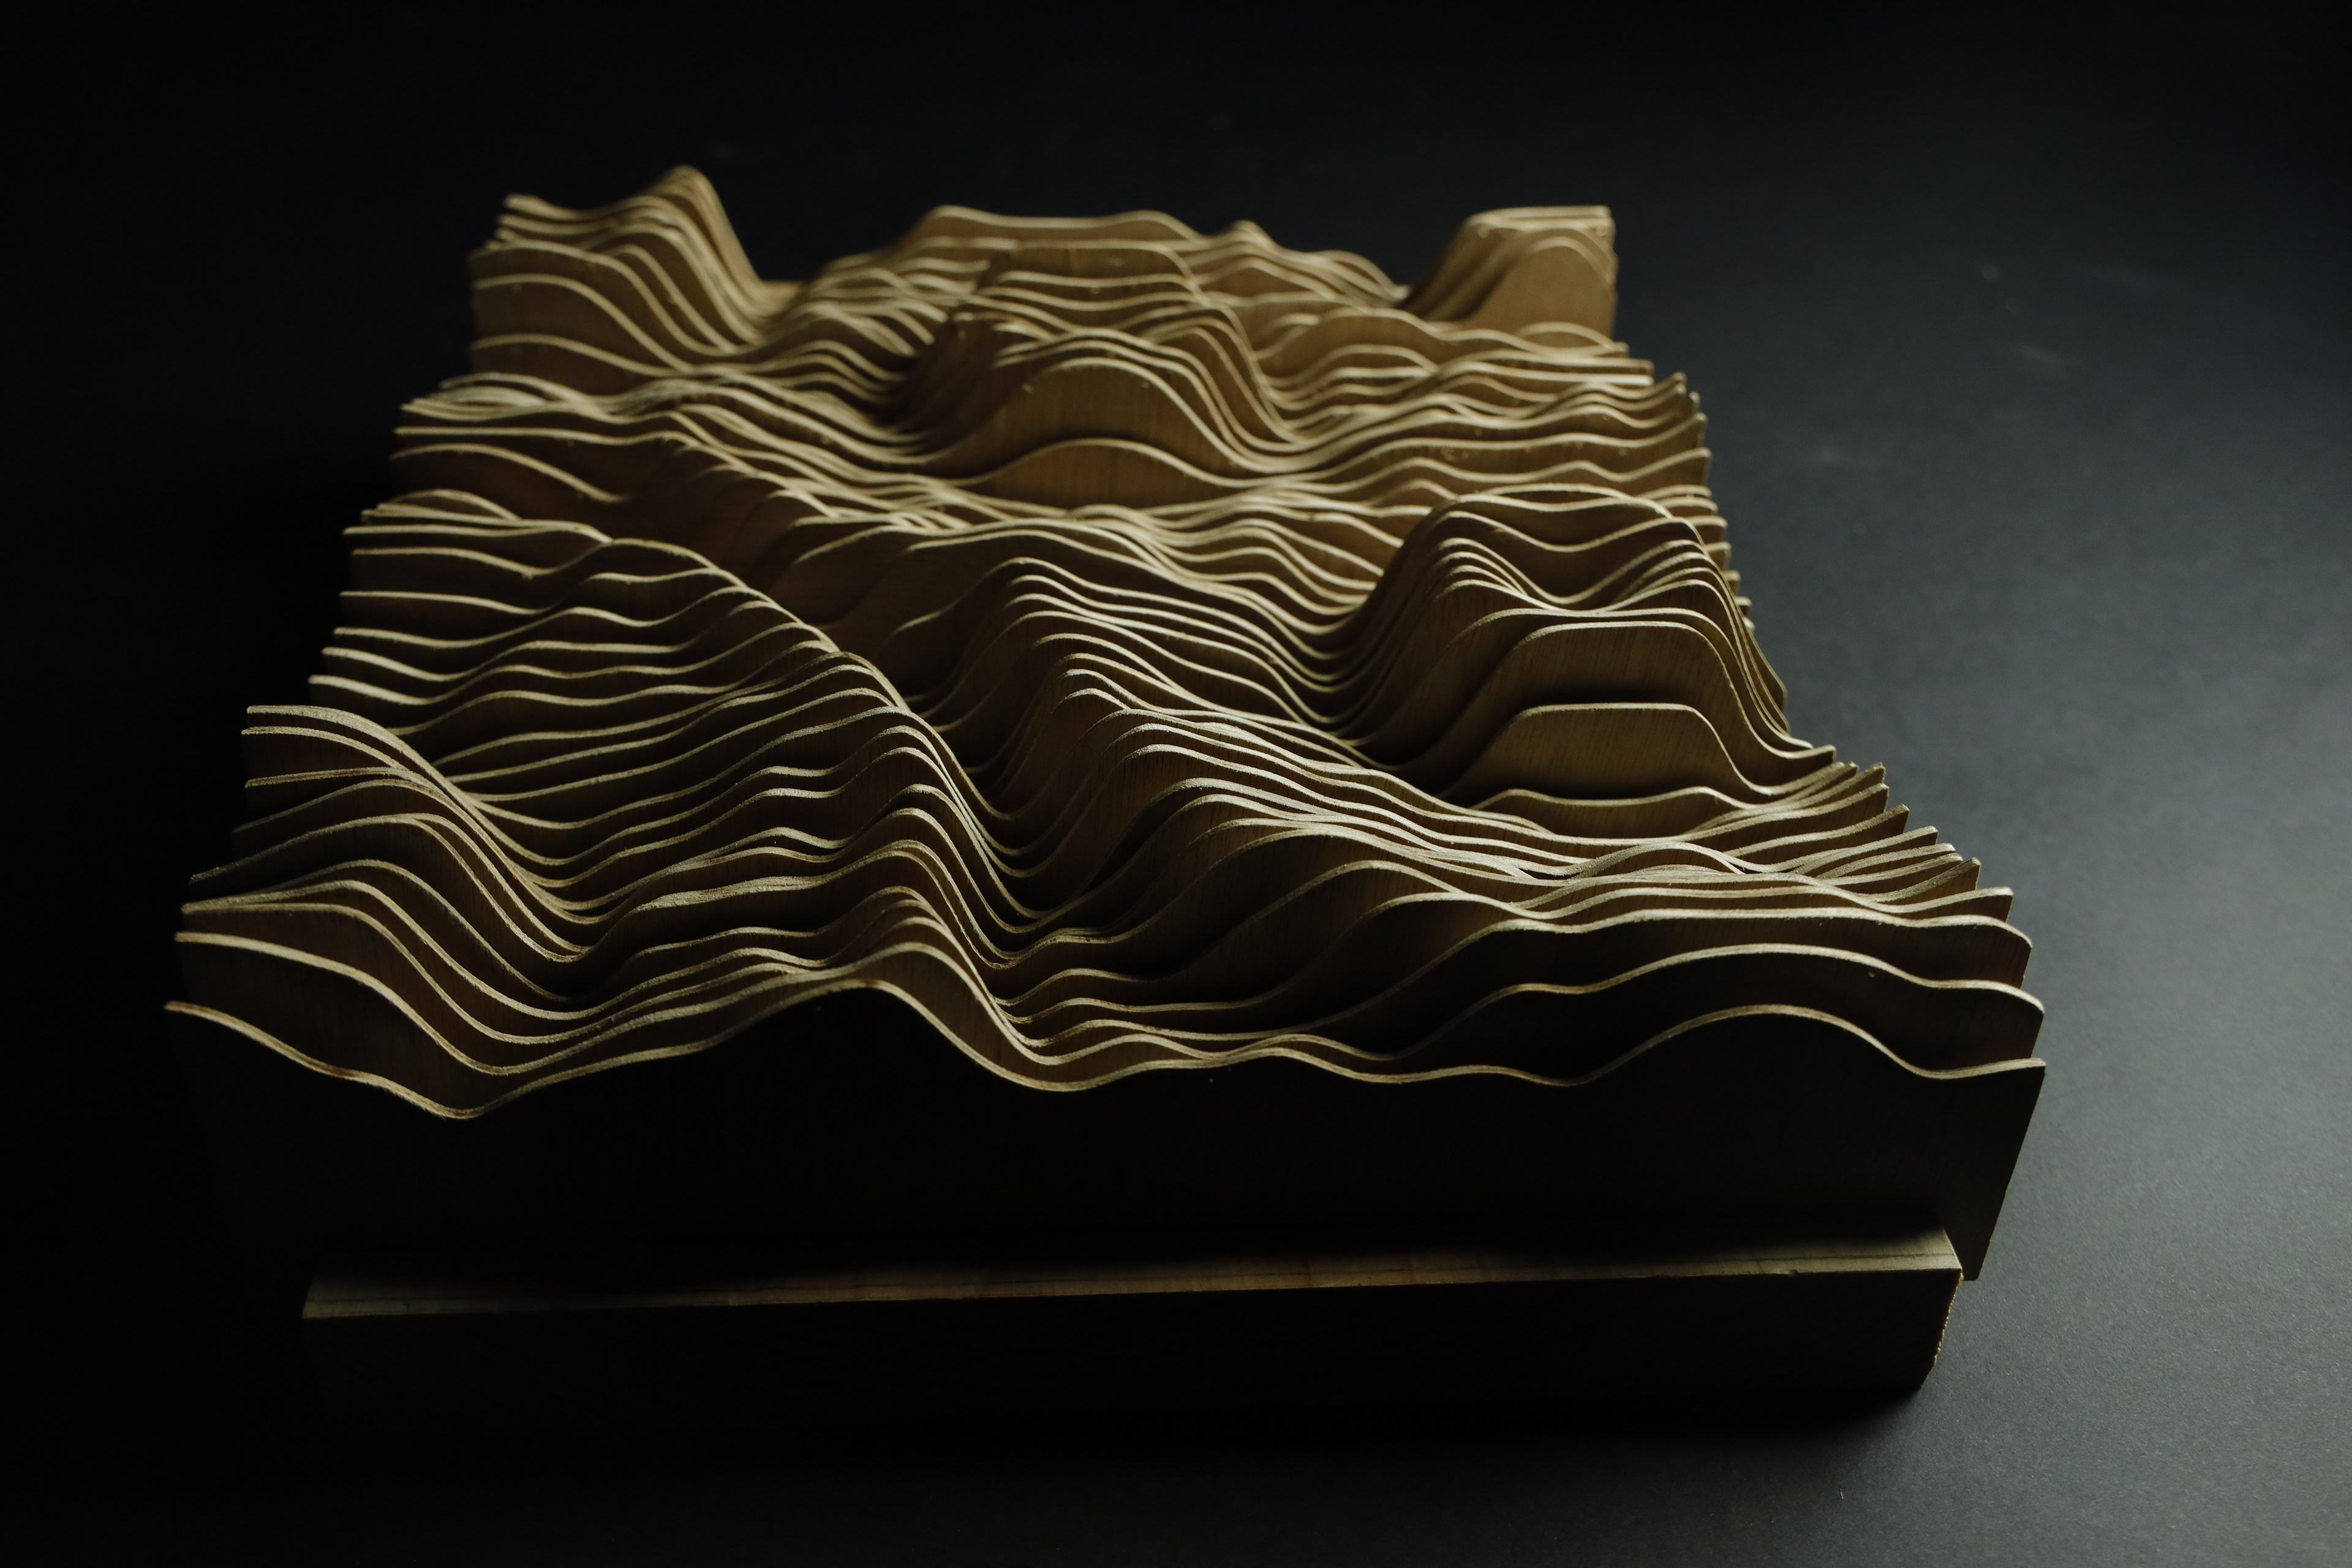
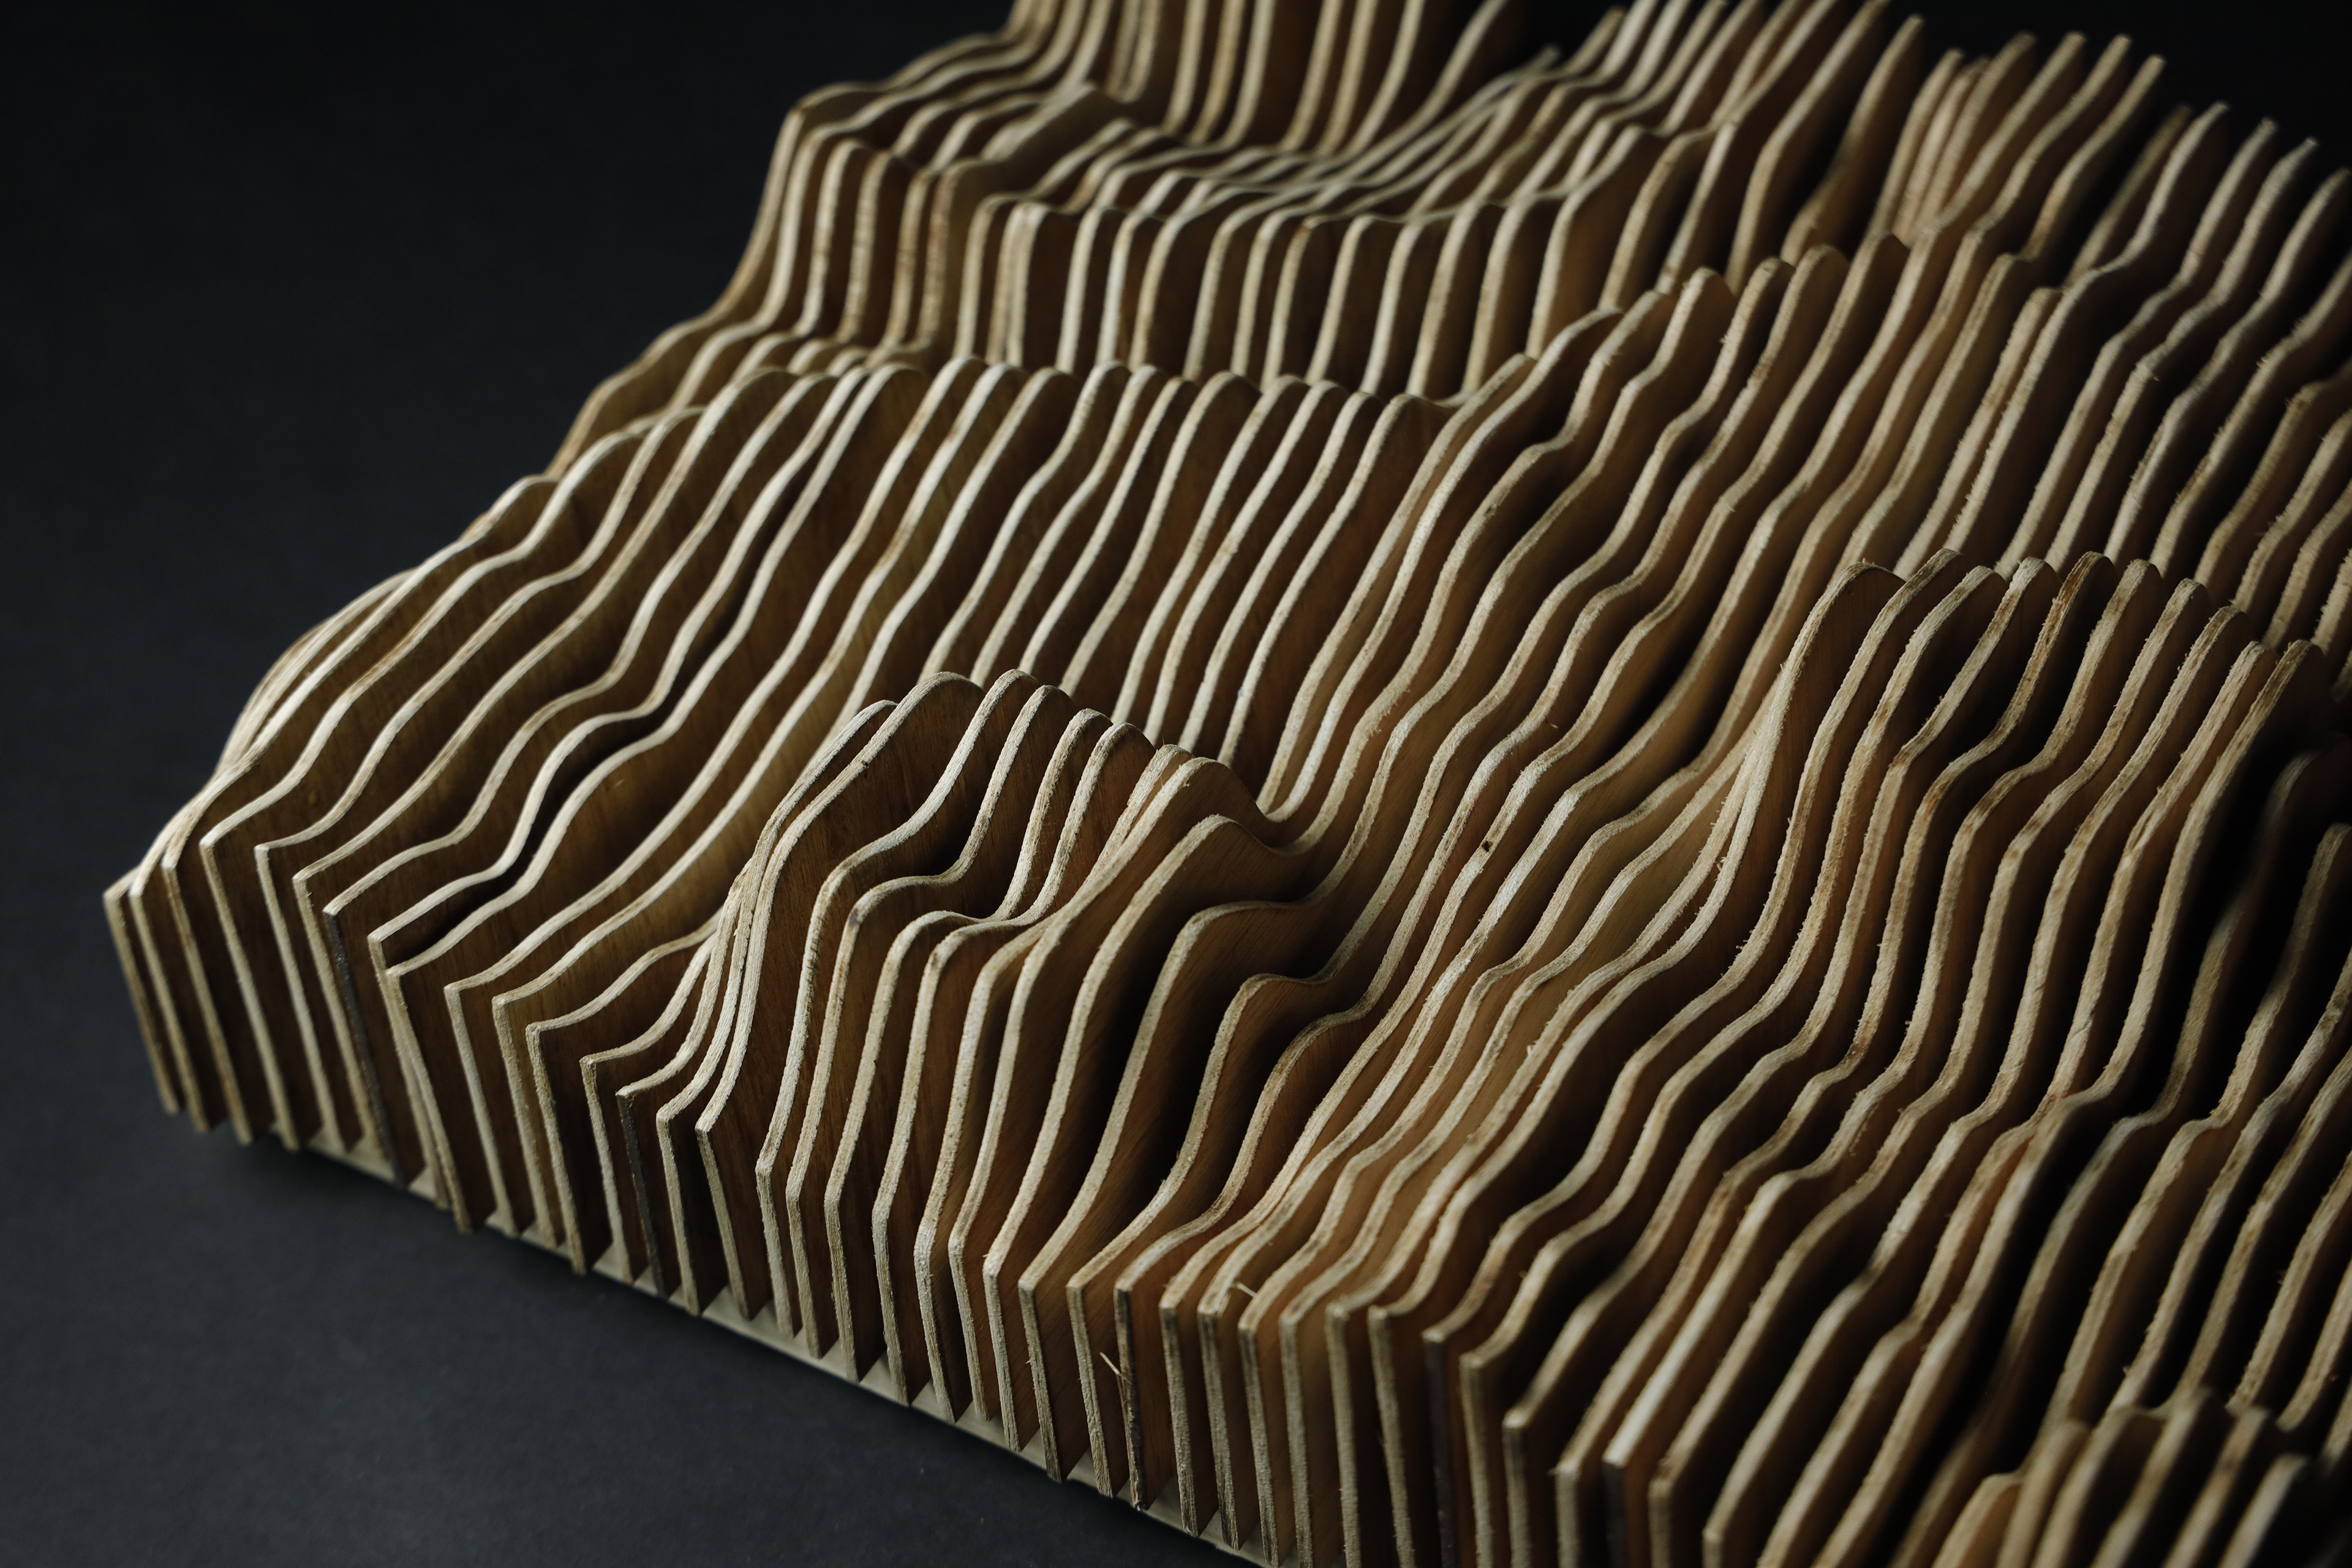
This is a data visualization project, when the data is just a string of numbers, people can't have intuitive knowledge and understanding of it, see a lot of data, and can't imagine the correlation between the data, as if this project expresses the model, each piece is a longitude on the house price data, presenting the form of high and low.When we combine all the data slices together, you will intuitively feel the reason for the change of the house price, when the city center of the house price will be lower, because most of them are old houses, but go to within 8 kilometers of the house price will increase dramatically, because it is very close to the center of the city, the public facilities are perfect, and it is convenient to live, but outside of the 8 kilometers of the house, the price will be lower and lower until further away, the product changes, from the apartments to the high-grade housing or villas, the price of will rise, but not higher than the city center, these intuitive feeling is purely analytical data can not reach!